
By EdCaptain editorial desk · Published
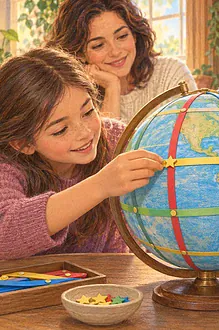
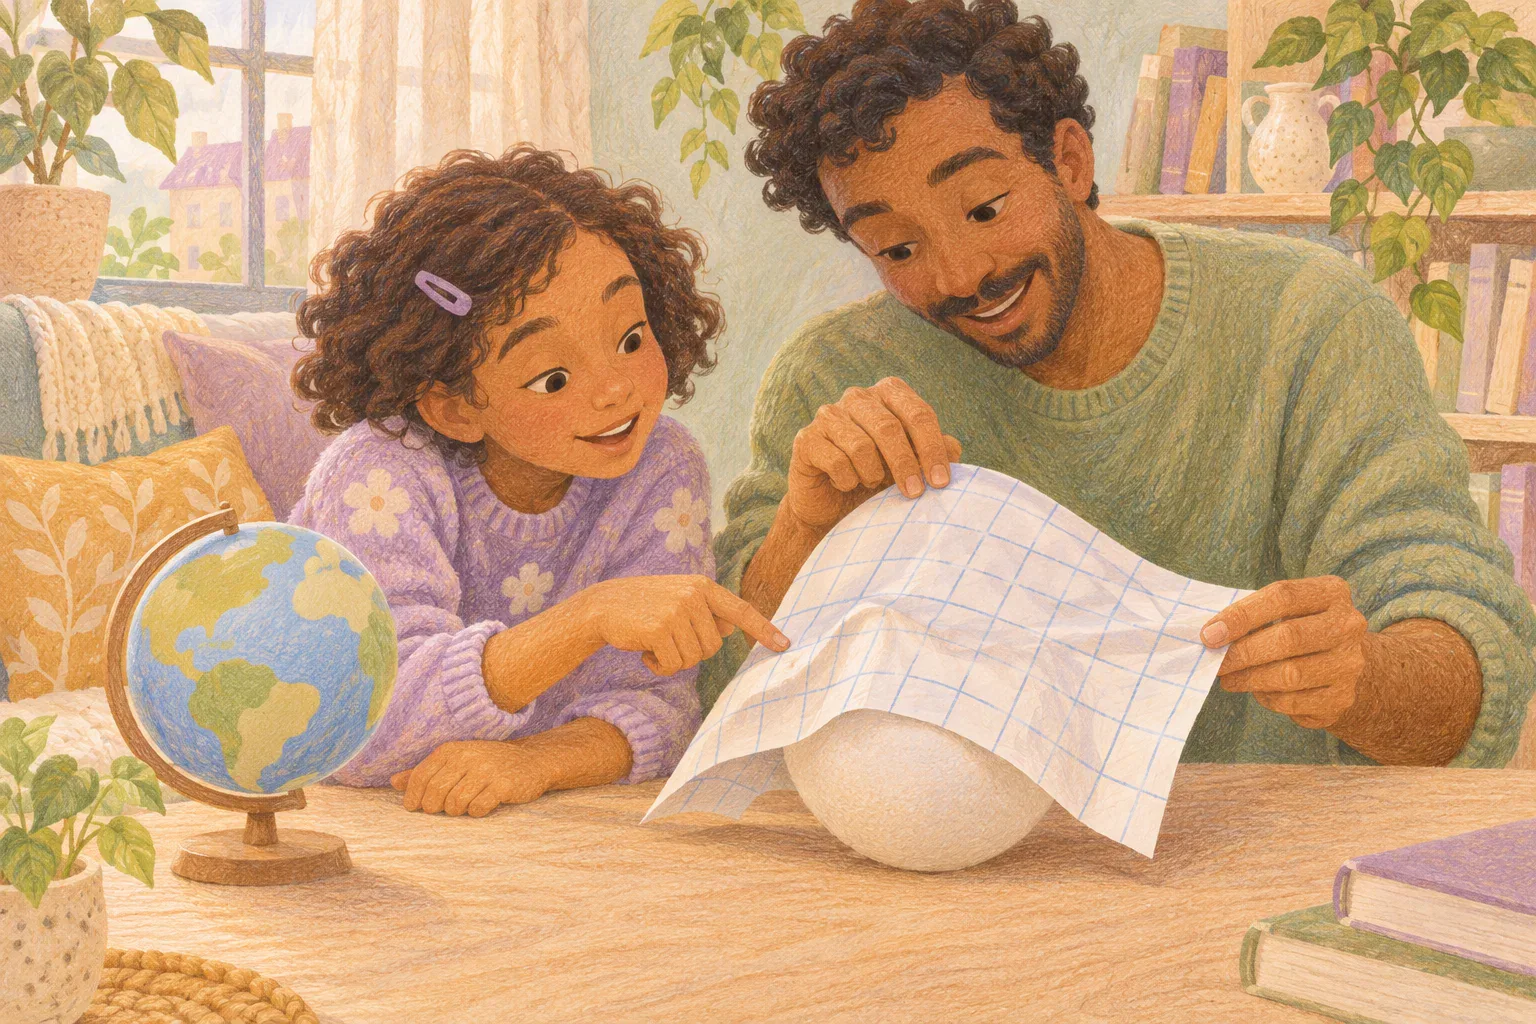
A child points to a world map: “Greenland looks nearly as big as Africa. Is it?” The short answer is no. Africa covers roughly fourteen times as much surface area as Greenland. On a Mercator world map, the way Earth is drawn makes land toward the poles look much larger relative to land near the Equator.
The useful lesson is more than correcting one comparison. Children can learn to ask what a map is designed to show before trusting the size of its coloured shapes. This conversation and map comparison suit children aged 6–12; you do not need a new atlas or a perfectly drawn globe.
Start with the map your child actually saw
Ask, “What made you think they were similar sizes?” Let your child point to the evidence. They have made a reasonable observation about a picture. Avoid responding as though they should already know that the picture changes proportions.
Next, look for the map’s title, publisher and projection name, often printed in small type near an edge. A projection is the method used to represent Earth’s curved surface on a flat page or screen. If the name is missing, say so. A rectangular outline alone does not establish that a map is Mercator.
Try: “You read the picture carefully. Now we need to check whether this kind of map keeps areas in proportion.” If the picture is a screenshot, an adult can find its original source. Do not ask your child to upload it or open an unfamiliar website alone.
Explain the trade-off without calling the map fake
A globe keeps the world round. A flat world map has to make compromises: it cannot preserve every area, shape, distance and direction perfectly across the entire planet. The US Geological Survey’s explanation of map projections describes why different jobs call for different choices.
With Mercator, enlargement becomes stronger toward the poles. Greenland is far north, so its displayed area becomes exaggerated compared with Africa. That does not mean the island has grown, or that Africa has shrunk. The drawing method changes the comparison.
Mercator also has a useful property: courses with a constant compass bearing appear as straight lines. You do not need to teach navigation to explain that a map can preserve something useful while being unsuitable for judging the relative areas of continents.
An equal-area world map keeps areas in proportion. It still changes shapes and other properties. “Equal area” does not mean every country is drawn the same size, and it does not promise that every distance measured with a ruler will be correct.
A short comparison you can do together
Gather: a pencil, scrap paper, and two clearly identified world maps: one Mercator and one equal-area projection, such as Equal Earth. A globe is optional. Use an atlas you already have, or let an adult open the checked Ordnance Survey guide to projections, which includes examples. Viewing the source is enough; there is no need to download or republish its maps.
Set both views large enough to inspect comfortably. Compare places within each map rather than measuring centimetres between maps printed or displayed at different sizes.
- Locate the same two places. Find Africa and Greenland on both maps. Clarify that you are comparing a continent with an island, not two countries. If needed, an adult points while the child names which is which.
- Record the first impression. Make two columns headed with the projection names. Under each, write or dictate: “Greenland looks…” Use observations such as “closer in size to Africa” or “much smaller than Africa.” A careful description matters more than an exact measurement.
- Check the real comparison. Read the Ordnance Survey explanation: Africa’s area is approximately fourteen times Greenland’s. This is a rounded comparison, not a claim that fourteen island-shaped pieces would fit neatly inside Africa’s outline.
- Revisit the pictures. Ask which map makes the area difference clearer. Look at the outlines too: a shape that appears unfamiliar on the equal-area map does not mean the place itself changed.
- Choose a map for a question. Ask, “Which would help us compare the surface area of these places?” Choose the equal-area view. Then ask, “Have we proved that it gets every distance right?” The answer is no; that requires checking a different property.
Finish with one sentence your child completes: “Before I compare sizes on a world map, I will check…” Keep their note beside the atlas rather than turning the activity into a test of remembered projection names.
Adjust the conversation to your child
For ages 6–9, start with only the two places and the question “Which covers more of Earth?” Explain that one drawing stretches some places more than others. Let the child point, speak or draw a large-and-small comparison. The adult handles the source reading.
For ages 10–12, add a map-choice challenge. Ask them to explain why preserving area does not preserve everything else. They can write a caption for the two views: “Same Earth, different drawing methods; use this one to compare areas.” Invite them to check a third place without assuming every northern place is enlarged by exactly the same amount.
Use enlarged views, high contrast and spoken descriptions when helpful. If comparing visual outlines is inaccessible, use the verified approximate area relationship as the starting information and discuss which map property a reader would need. A child can direct the adult’s pointing or take the role of checking the map’s label.
Keep curiosity bigger than the correction
If your child says, “Then all maps are wrong,” try: “Every flat world map has limits. We can still use one well when we know its job.” Avoid telling them to distrust their teacher or throw away an atlas. Add a note identifying the projection and use another view when area matters.
For another kind of map question, the latitude-and-longitude treasure game explores how to locate a place. The clay hill contour activity explores how flat lines can describe height. Those are different tasks from comparing Greenland’s area with Africa’s.
Sources and further reading
- US Geological Survey: why different map projections serve different purposes.
- Ordnance Survey: projection properties and the Greenland–Africa comparison.
- University of Bayreuth: an explanation of comparing world maps and a globe.
Read our editorial policy and review methodology.